
The Network tab's Analyze Device screen provides an in-depth view of each SIM's use history and risk level, which helps you to effectively manage your devices. This article provides instructions for accessing, navigating, and exporting information from the Analyze Device screen.
In this article:
Basics
The Analyze Device screen provides an overview of the selected SIM's information and use history, which can help determine whether the device is compromised. The Analyze Device screen includes two major sections:
- Device Summary: Provides basic SIM information (e.g., ICCID, IMSI, etc.).
-
Indicators of Compromise: Displays one of the following types of device
activity from a specified time frame as an adjustable chart and table:
- Data Transactions: Amount of data processed.
- Data Volume: Amount of data transmitted.
- DNS Queries: Cellular traffic.
- Destination Endpoints: Destinations of transmission activity.
- IP Flows: Traffic between a device and an endpoint.
Accessing the Analyze Device Screen
To access the Analyze Device screen:
Note: Customers who purchase the Deep Forensics security feature can also access the Analyze Device screen from the Security Dashboard through the ANALYZE DEVICE drop-down menu and dashboard widgets.
- Log in to the AerPort portal.
- In the navigation menu, select SIMs > Manage SIMs.

- On the Manage SIMs page, select the SIM you want to view. This opens the SIM Information window.
- Under SIM Operations, click Analyze device to open the Analyze
Device screen.

Navigating the Analyze Device Screen
The Analyze Device screen includes two major sections:
- Device Summary: Displays information about the selected SIM.
- Indicators of Compromise: Displays device activity information in charts and tables.
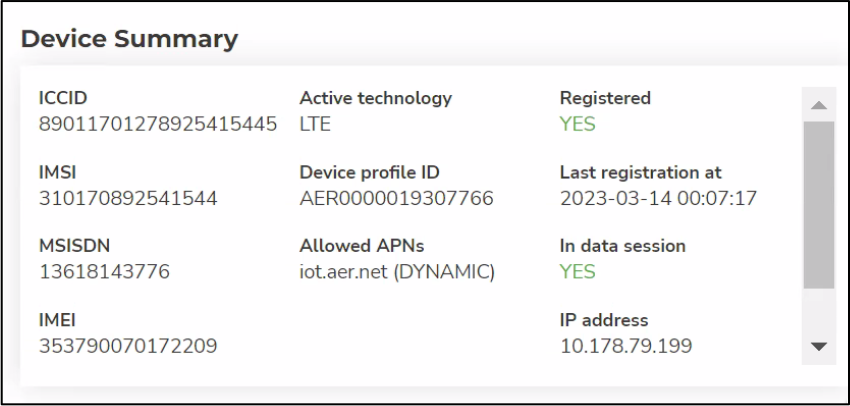
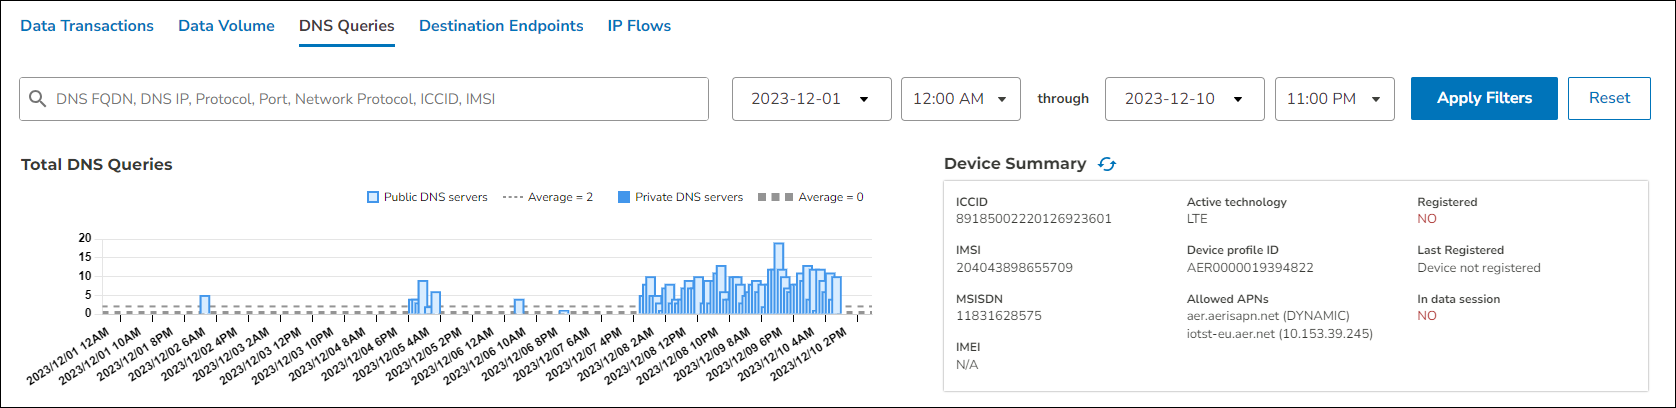
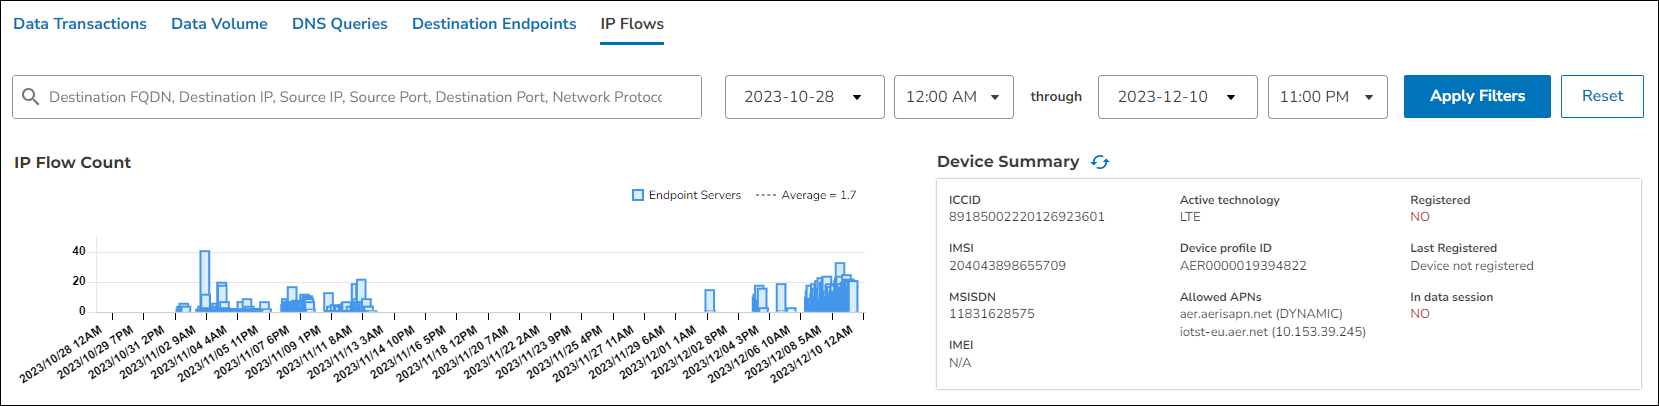
Device Summary
The Device Summary section displays the following information for the selected SIM:
- ICCID: Identification number of the SIM.
- IMSI: Identification number of the device user.
- MSISDN: Subscription number of the device.
- IMEI: Identification number of the device.
- Active technology: Technology enabled for the SIM (e.g. LTE).
- Device profile ID: Identification number of the device profile.
- Allowed APNs: Approved access point names (APNs).
- Registered: Time and date the device was first registered.
- Last registered at: Time and date the device was last registered.
- In data session: Whether the SIM is currently transmitting or receiving data.
- IP address: IP address of the device.
Indicators of Compromise
The Indicators of Compromise section tracks SIM activity and displays it in charts and tables, so you can easily identify anomalous or suspicious SIM activity. The Analyze Device screen displays the following indicators of compromise:

You can navigate among indicators by selecting the tabs in the above image. Each chart includes the following filter tools:
- Search bar: Enables you to search for and locate specific device activity instances.
- Date filter: Enables you to set start and end dates for the activity instances displayed in the chart.
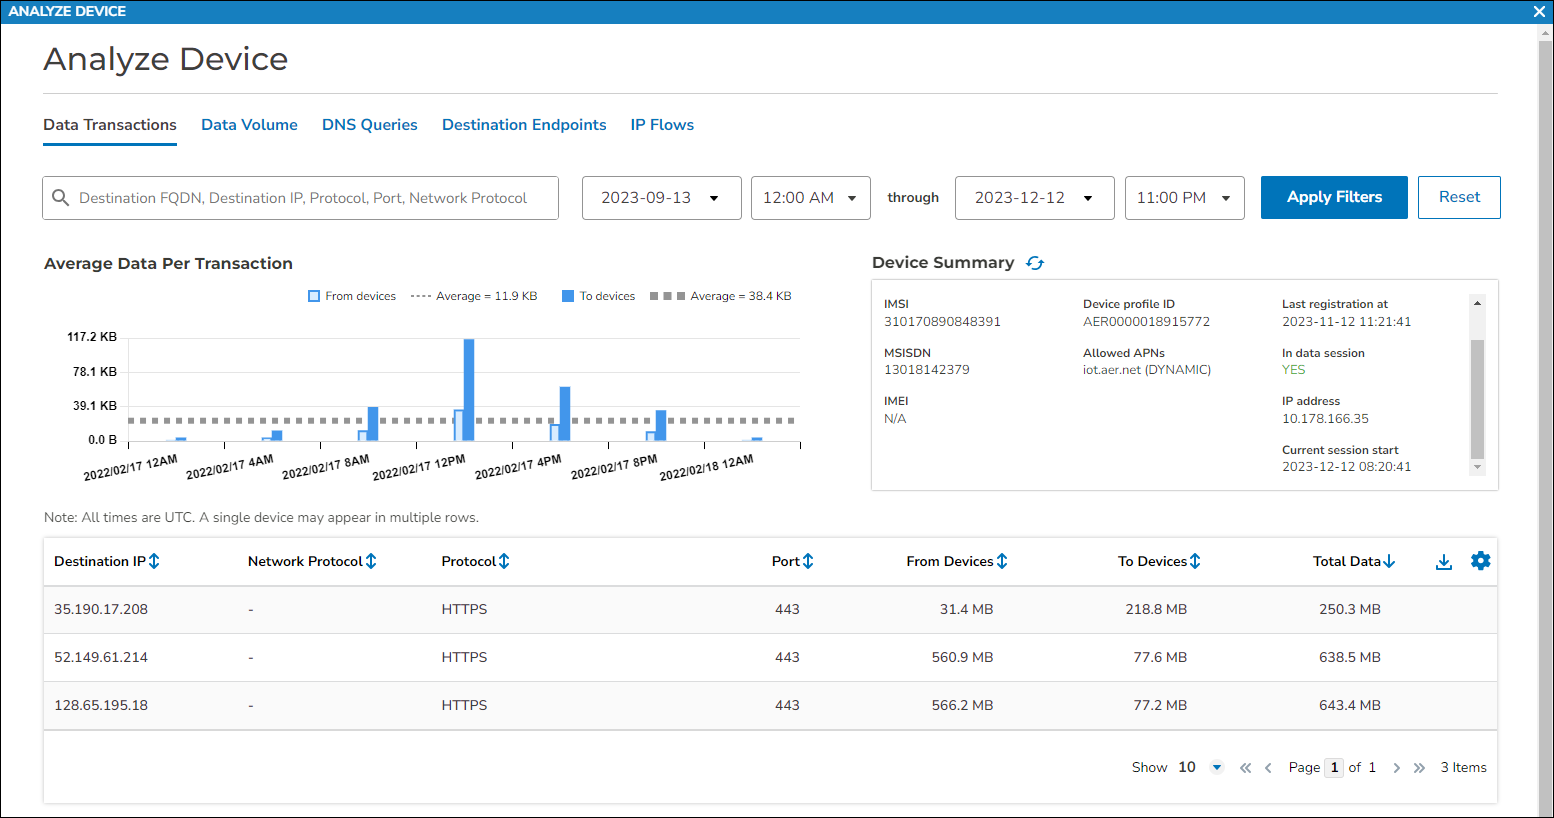
Data Transactions
The Data Transactions chart displays the amount of data processed over the selected time period. The legend above the chart outlines the significance of each color, symbol, and line type in the graph.
![]()
The table below the chart may display the following information for each activity instance in the selected time period:
- Destination FQDN: Fully qualified domain name (FQDN) of the data's destination.
- Destination IP: IP address of the data's destination.
- Network Protocol: Network protocol used in each instance.
- Protocol: Data transfer protocol used in each instance.
- Port: Number of the port that received the data.
- From Devices: Amount of data processed by the device that sent the data.
- To Devices: Amount of data processed by the device that received the data.
- Total Data: Total amount of processed data.
Note: To add or remove column headers, click the settings icon on the table and check/uncheck headers as needed.
![]()
Data Volume
The Data Volume chart displays the amount of data transmitted over the selected time period. The legend above the chart outlines the significance of each color, symbol, and line type in the graph.
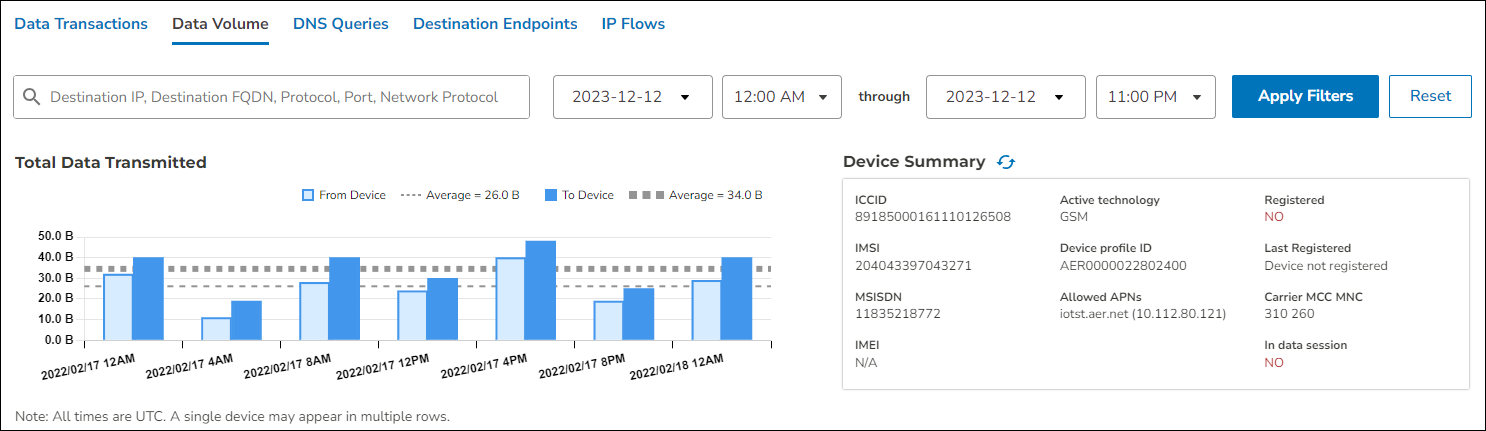
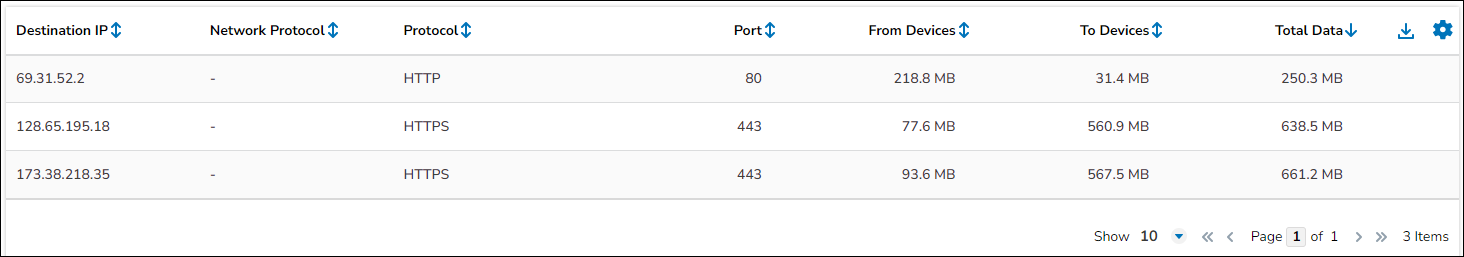
The table below the chart may display the following information for each activity instance in the selected time period:
- Destination FQDN: Fully qualified domain name of the data's destination.
- Destination IP: IP address of the data's destination.
- Network Protocol: Network protocol used in each instance.
- Protocol: Data transfer protocol used in each instance.
- Port: Number of the port that received the data.
- From Devices: Amount of data processed by the device that sent the data.
- To Devices: Amount of data processed by the device that received the data.
- Total Data: Total amount of processed data.
Note: To add or remove column headers, click the settings icon on the table and check/uncheck items as needed.
DNS Queries
The DNS Queries chart displays the amount of cellular traffic that occurred over the selected time period. The legend above the chart outlines the significance of each color, symbol, and line type in the graph.
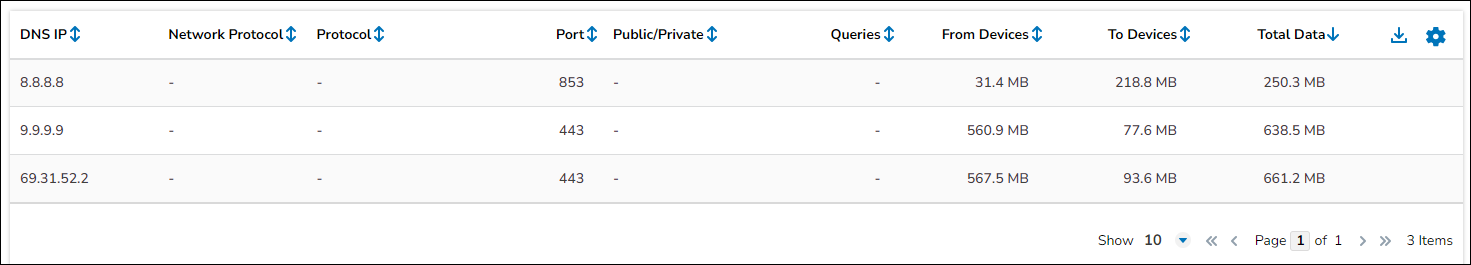
The table below the chart may display the following information for each activity instance in the selected time period:
- DNS FQDN: Fully qualified domain name of the data's destination.
- DNS IP: IP address of the data's destination.
- Network Protocol: Network protocol used in each instance.
- Protocol: Data transfer protocol used in each instance.
- Port: Number of the port that received the data.
- Public/Private: Whether the cellular traffic was private or public.
- Queries: Number of requests for data.
- From Devices: Amount of data processed by the device that sent the data.
- To Devices: Amount of data processed by the device that received the data.
- Total Data: Total amount of processed data.
Note: To add or remove column headers, click the settings icon on the table and check/uncheck items as needed.
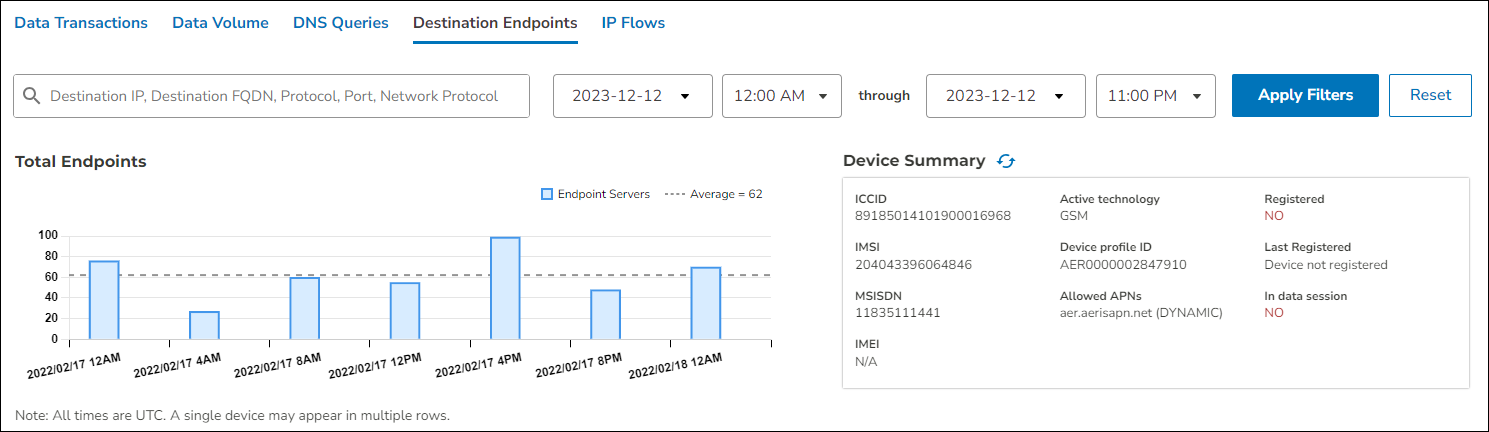
Destination Endpoints
The Destination Endpoints chart displays the destinations of transmission activity from the selected period of time. The legend above the chart outlines the significance of each color, symbol, and line type in the graph.
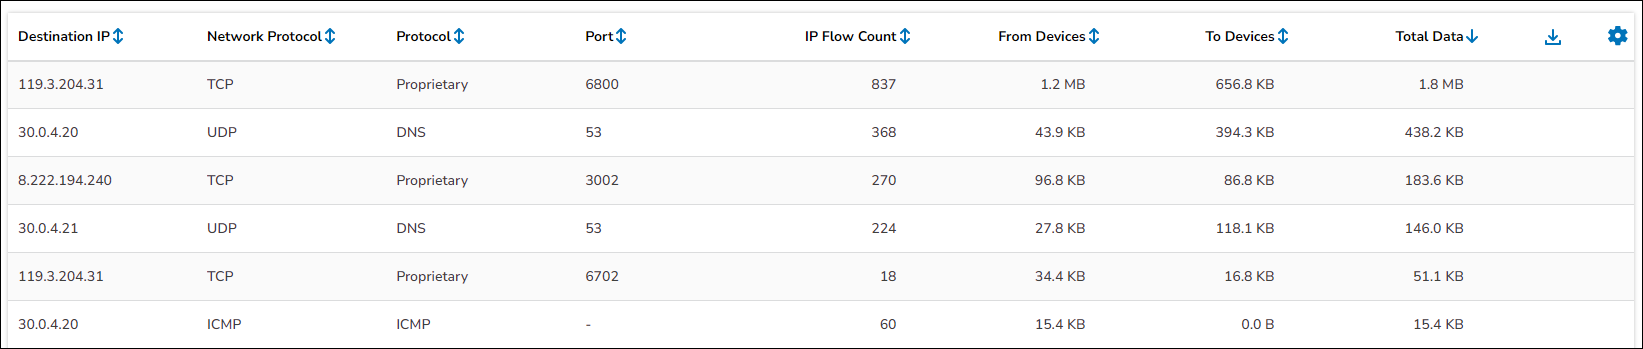
The table below the chart may display the following information for each activity instance in the selected time period:
- Destination FQDN: Fully qualified domain name of the data's destination.
- Destination IP: IP address of the data's destination.
- Network Protocol: Network protocol used in each instance.
- Protocol: Data transfer protocol used in each instance.
- Port: Number of the port that received the data.
- IP Flow Count: Number of Netflows observed for the destination endpoint. A Netflow is a record of IP flow traffic between a device and server that contains communication metrics at the Source IP, Source Port, Destination IP, Destination Port, and Protocol level.
- From Devices: Amount of data processed by the device that sent the data.
- To Devices: Amount of data processed by the device that received the data.
- Total Data: Total amount of processed data.
Note: To add or remove column headers, click the settings icon on the table and check/uncheck items as needed.
IP Flows
The IP Flows chart displays all traffic between a device and an endpoint from when the alarm was triggered. The legend above the chart outlines the significance of each symbol and line type in the graph.
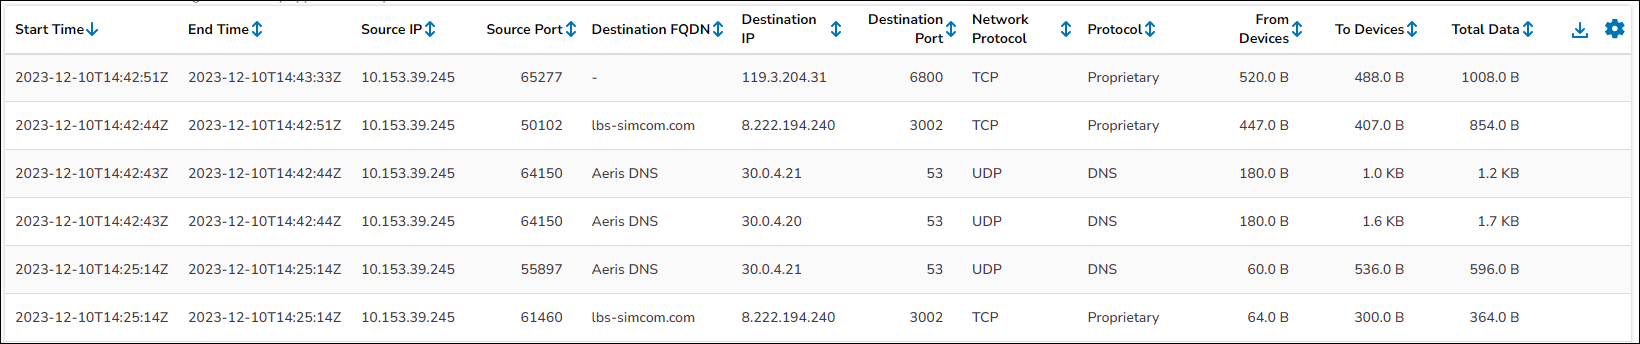
The table below the chart may display the following information for each activity instance in the selected time period:
- Start Time: Timestamp that marks the beginning of the data exchange.
- End Time: Timestamp that marks the end of the data exchange.
- Source IP: IP address that indicates the data's origin.
- Source Port: Number of the port that transmitted the data.
- Destination FQDN: Fully qualified domain name of the data's destination.
- Destination IP: IP address of the data's destination.
- Destination Port: Number of the port that received the data.
- Network Protocol: Network protocol used in each instance.
- Protocol: Data transfer protocol used in each instance.
- From Devices: Amount of data processed by the device that sent the data.
- To Devices: Amount of data processed by the device that received the data.
- Total Data: Total amount of processed data.
Note: To add or remove column headers, click the settings icon on the table and check/uncheck items as needed.
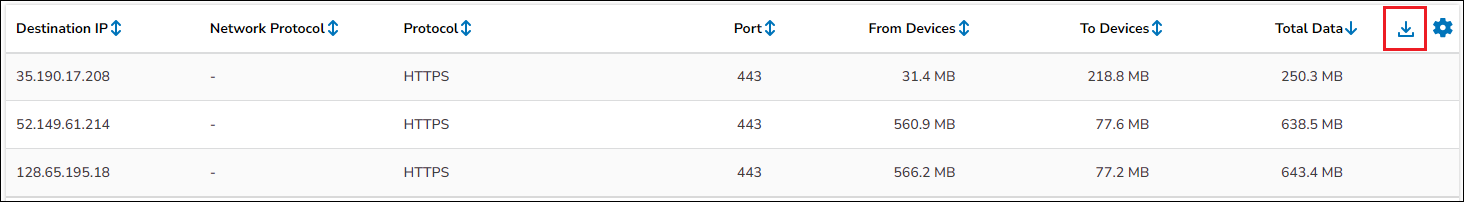
Exporting the Charts
The Analyze Device screen includes a downlaod icon that enables you to export the
selected chart data as a .csv file.
You can open the .csv file by importing it through the Microsoft Excel
Data menu:
- Open Microsoft Excel and create a blank workbook.
- Select Data > From Text or From Text/CSV.
- Locate the
.csvfile in your Downloads or other designated folder. - Right-click the file and select Import.
- Follow the subsequent prompts to specify a comma-delimited file.
- If you see an option for Data Type Detection, select Do not detect data types.
0 Comments